


Back to Housing: When Should We Worry About Rising Inventory?
I was able to make it one day before I started talking about housing again

I didn’t start this newsletter with the intention of only writing about housing, but it’s kind of worked out that way so far because I’m finding the potential housing market swoon to be one of the more interseting stories at the moment. Part of the reason for this is that I’d like to buy a house someday so am particulary concerned with what could make them more affordable, but it’s also because of how the housing market turning down could affect the overall US economy.
Aziz Sunderji of Home Economics had an interesting post on how rising inventory flows through to housing prices. He uses a regression-based analysis to estimate the inventory level at which prices begin to weaken and how far in advance that signal appears.
When Should We Worry About Rising Inventory? – Home Economics
His conclusion:
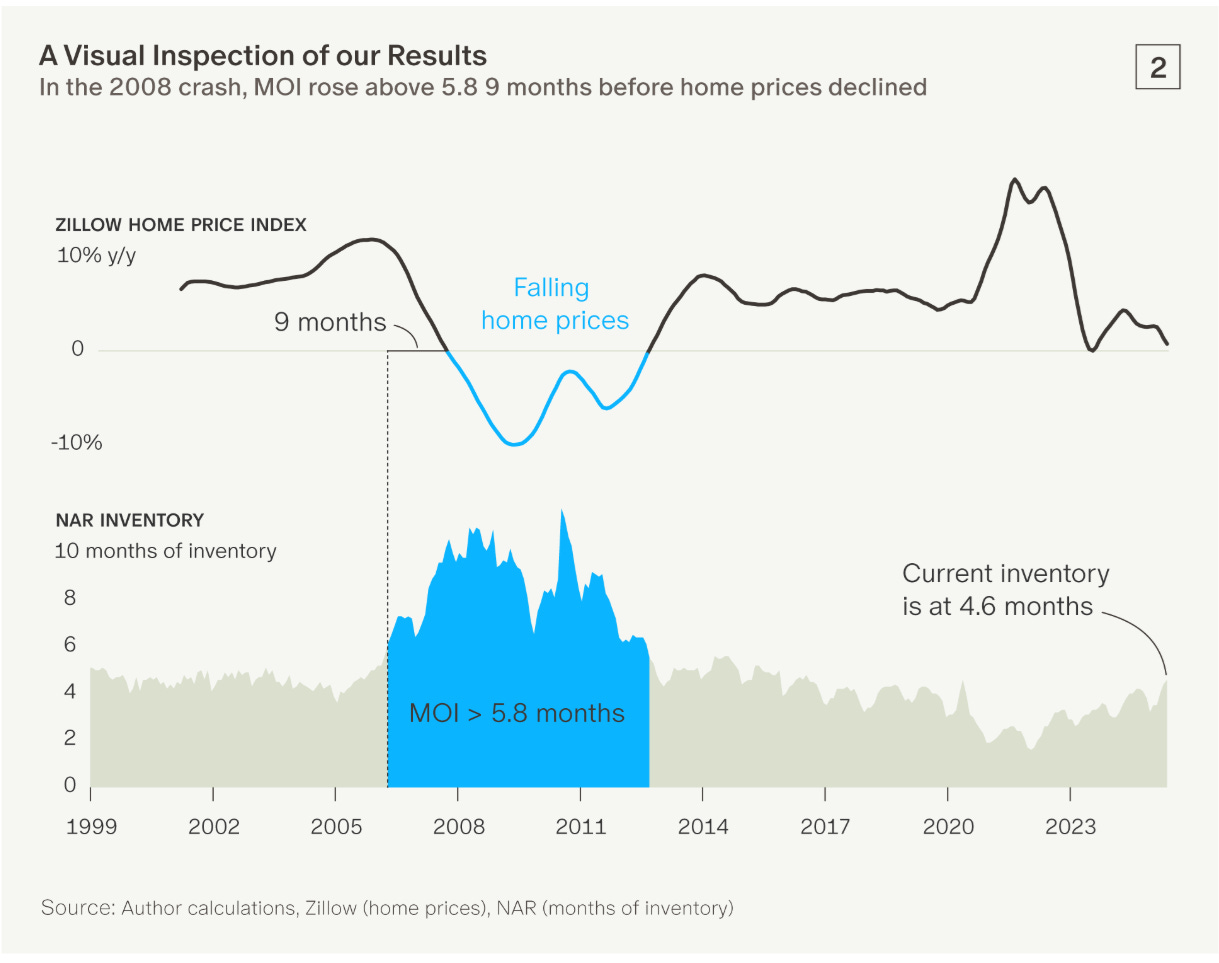
We estimate the inventory threshold at 5.0 months. Below that level, inventory has only a weak relationship with year-over-year home price changes. But above it, the relationship becomes more clearly negative, signaling price declines 9 months in the future.
Importantly, this is not a vague association. The fit is unusually strong: our best-performing model—a 9-month lag with a 5.0-month threshold—yields an adjusted R² of 0.75, indicating that it explains a substantial share of the variation in home price growth.
Based on the model coefficients, we calculate that the predicted change in home prices turns negative at 5.81 months of inventory.
In other words, once inventory rises above 5.0 months, prices tend to soften. If inventory climbs above 5.81, the model implies that year-over-year price declines are likely to follow—with a lead time of about 9 months.
Looking forward, he goes on to say:
National inventory currently stands at 4.6 months, based on the latest data (for May 2025). That’s below the threshold—but uncomfortably close.
Given the recent pace of increase—about 0.36 months of inventory per month—we have likely already hit the 5.0-month softening threshold f, and will cross the 5.81-month tipping point for price declines in August 2025.
If that trajectory holds, and the model’s nine-month lead time applies, then year-over-year price declines would likely begin around May 2026.
Now there are some issues around giving this level of precision in a data sample that only contains one episode of negative price growth, but the conceptual linkage that more supply relative to demand leads to falling prices is true. Looking at regional data, this certainly seems to be bearing out.
Here is inventory data from a year ago:

And here is the price change a year later (the maps are aggregated differently, so it’s not a like-for-like comparison, but I think with a little intuition you can see the point):

Finally, to belabor a point I’ve made previously about places where you can build houses having different supply/demand balances relative to where homebuilding is difficult:

So, to summarize: I don’t know if it’s 5.8 months of supply that’s the tipping point or not, but there is some level of housing inventory relative to demand that will cause prices to go down, and places like Texas and Florida will be an interesting case study for how this will play out. So far, it’s going exactly like you’d think it would.